
The animal report is everything on file for one animal, over whatever period you want. It is the thing to send a buyer, and the thing to read when an animal is off.
Getting there
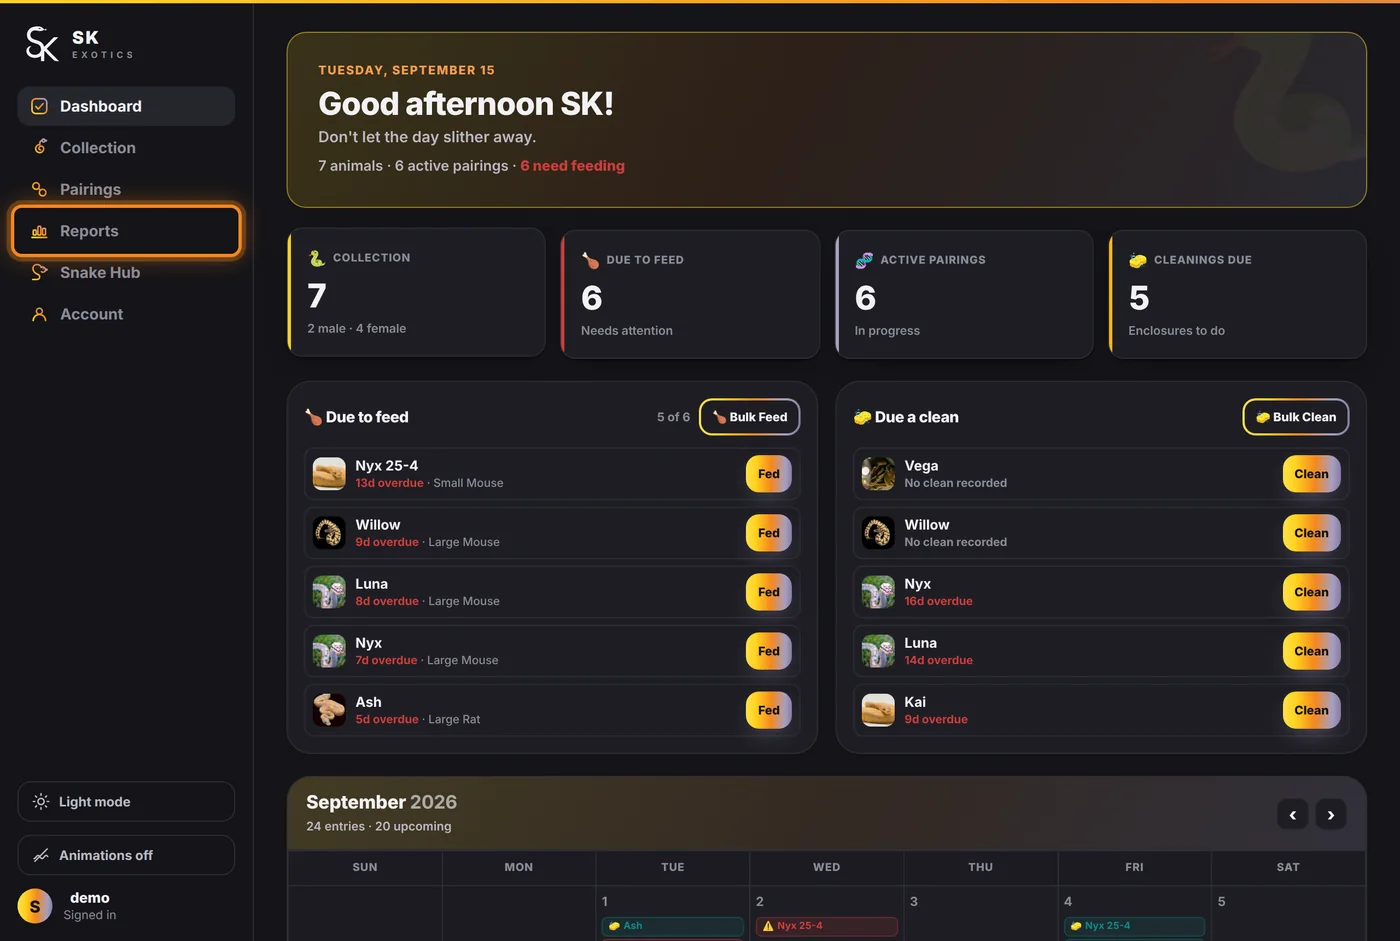
Reports in the sidebar.
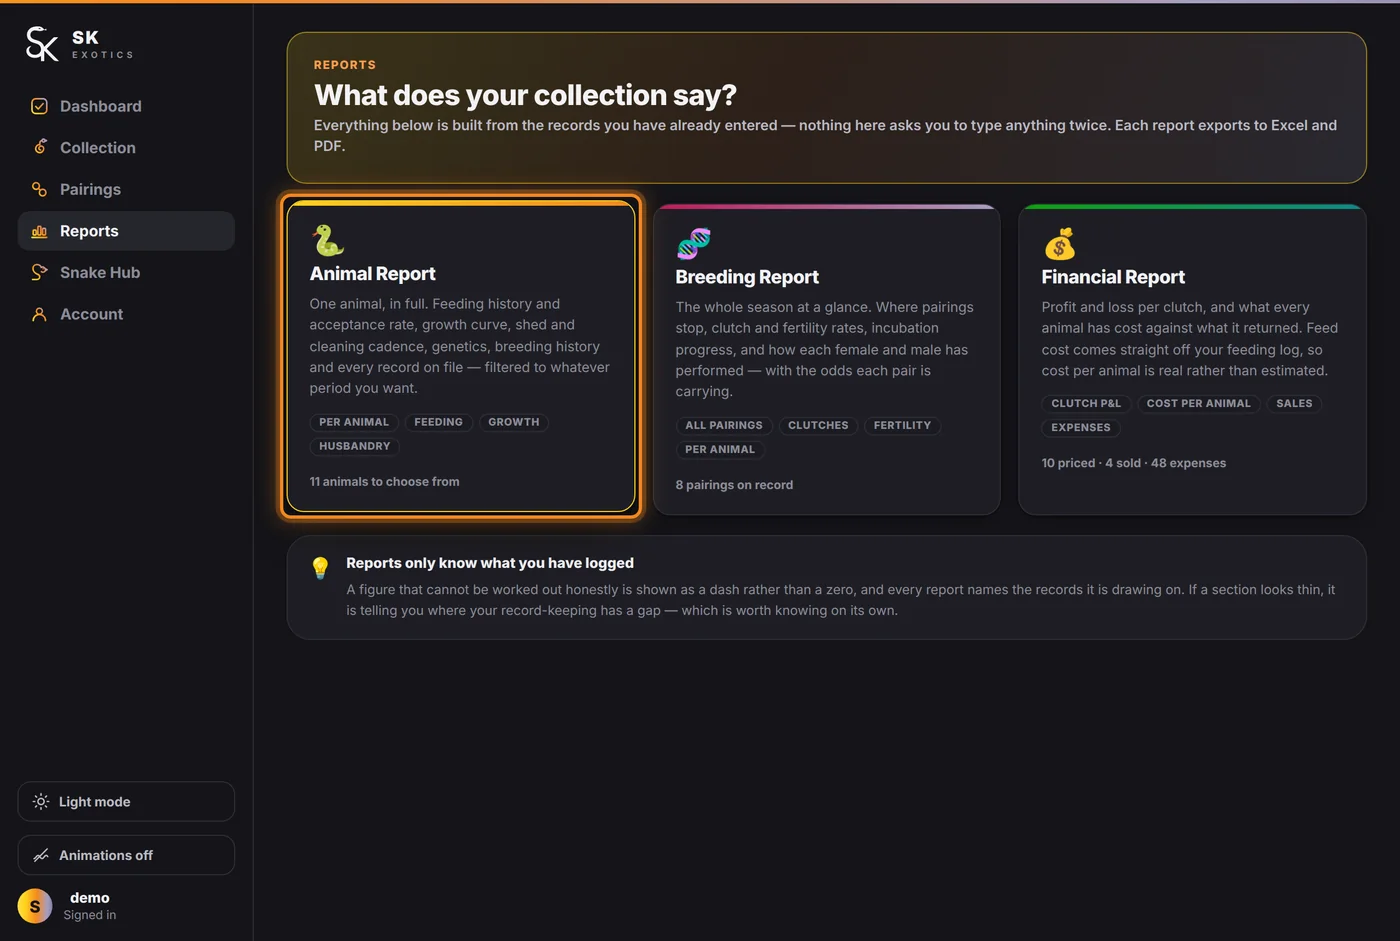
Then the Animal Report card.
Choosing what you are looking at
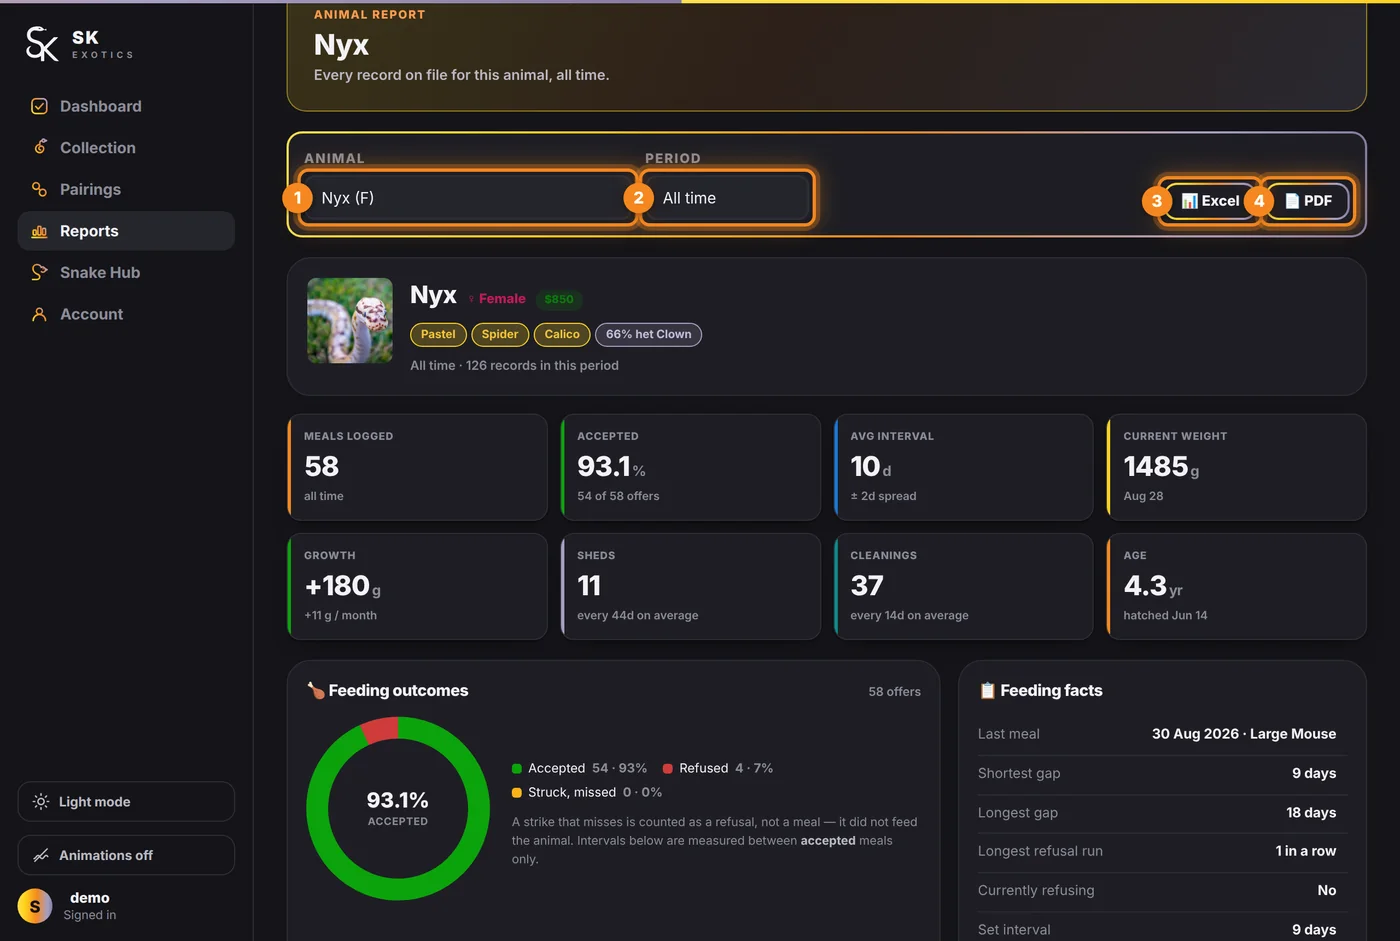
- 1. Animal — every animal in your collection, with sex beside the name.
- 2. Period — All time, Last 90 days, Last 6 months, Last 12 months, This year, or a custom range. Changing the period rebuilds every figure below it.
- 3. Excel — exports exactly what is on screen, for the period you have chosen.
- 4. PDF — the same, as a PDF.
The eight figures
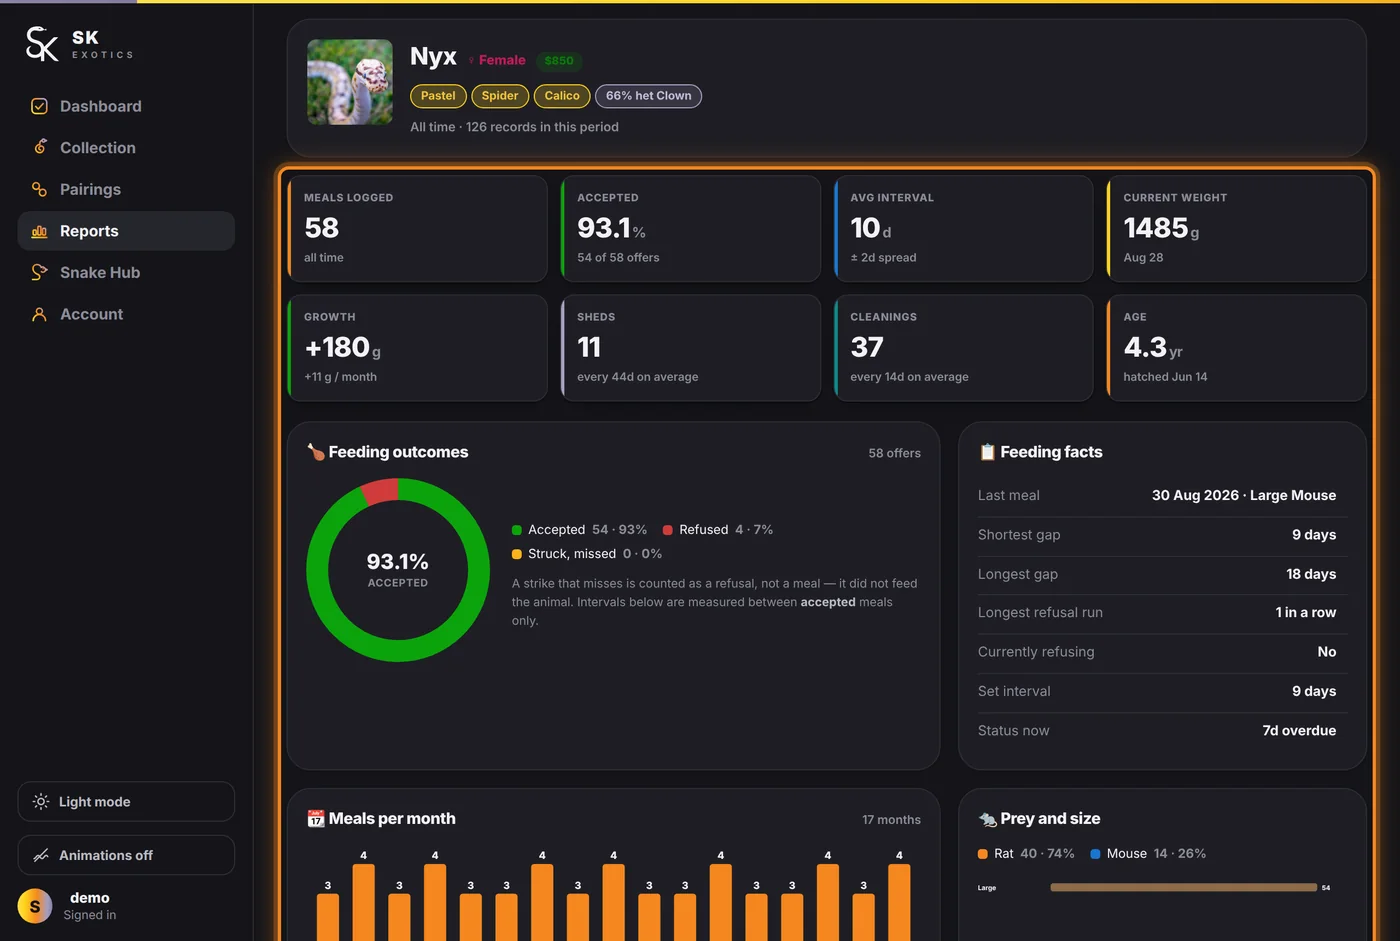
- Meals logged and Accepted — the acceptance rate, with the raw count under it. A rate that drops is usually the first sign of a problem.
- Avg interval — the animal's own average gap between meals, with the spread. This is what the dashboard's due dates are built from.
- Current weight and Growth — the latest weigh-in and the change over the period, with a per-month figure.
- Sheds — how many, and the average gap.
- Cleanings — how many, and the average gap.
- Age — from the hatch date.
Below the figures
Feeding outcomes and feeding facts, meals per month, prey and size, the growth curve, husbandry cadence, events by type, record activity by month, breeding history — and then the full feeding, event and weight logs, dated. All of it respects the period selector.
A dash rather than a number means the figure cannot be worked out honestly from what has been logged — not that the answer is zero. If a section looks thin, it is showing you a gap in the record.